
RESEARCH ARTICLE
Assessment of Decay Coefficients of Allochthonous Litter for Sustainable Riparian Forage Agriculture and Environmental Monitoring: A Study in River Nyangores, Kenya
J. Ochieng1, 2, *, C.E. Kitur1, P.T. Obade1
Article Information
Identifiers and Pagination:
Year: 2016Volume: 10
First Page: 14
Last Page: 25
Publisher Id: TOASCJ-10-14
DOI: 10.2174/1874282301610010014
Article History:
Received Date: 03/02/2016Revision Received Date: 27/06/2016
Acceptance Date: 28/06/2016
Electronic publication date: 31/08/2016
Collection year: 2016
open-access license: This is an open access article licensed under the terms of the Creative Commons Attribution-Non-Commercial 4.0 International Public License (CC BY-NC 4.0) (https://creativecommons.org/licenses/by-nc/4.0/legalcode), which permits unrestricted, non-commercial use, distribution and reproduction in any medium, provided the work is properly cited.
Abstract
Research on decay profiles of grass detritus in lotic systems has received little attention in preceding years. An investigation was conducted on in-situ processing coefficients for three dominant forage species grown by farmers along the banks of River Nyangores in 2013. The objectives of the study were; (i) to determine in-situ processing coefficients for Pennisetum purpureum, Panicum coloratum and Chloris gayana, and (ii) to estimate detrital total phosphorus trends during incubation. It was hypothesized that no significant differences existed among the decay rates of the three grass species. A total of 186 leaf packs were deployed in River Nyangores at upstream and downstream sections separated by Bomet urban settlement for ten weeks, with a two-week withdrawal interval. Temperature normalized decay rates were estimated using an aquatic decay model. Total phosphorus was analyzed using the molybdate-calorimetric procedure with ultraviolet spectrophotometry. Data was analyzed using XLSTAT-2014 computer program. The in-situ decay coefficients ranged from 6.70795 x 10⁻⁴ dd-1 to 9.12355 x 10⁻⁴ dd-1. Covariance analysis (p<0.05) indicated significant differences for the decay rates among the three species, with higher in-situ processing coefficients recorded downstream than upstream for all the grasses. Litter phosphorus showed positive Pearson correlation with decay rates though not significant (p>0.05). During incubation, detrital phosphorus build-up was lower upstream at 6.4% than downstream at 13.8%. Highest decay rate was recorded for Chloris gayana hence it appears to be the most agro-ecologically sustainable as a riparian forage for River Nyangores. Bomet urban settlement seemingly contributes to shifts in ecological functioning of the river.
1. INTRODUCTION
Energy inputs into streams are derived from two major sources. The first of these is the photosynthesis by algae, mosses and higher aquatic plants. The second source comes from imported (allochthonous) organic matter from streamside vegetation that includes leaves and other parts of vegetation [1]. The narrow channels of headwater streams contribute to dominance of their energy inputs by allochthonous sources [2]. Adjacent riparian ecosystems do produce coarse particulate organic matter that enter streams through direct litter fall or lateral flow [3].
Aquatic breakdown studies for grasses have gained less attention in the recent past, though many streams receive great quantities of grass litter [4]. Additionally, many studies have revealed their importance as energy inputs in streams both for micro consumers and macroinvertebrates [5-8]. Leaf in-situ processing coefficients have been researched more for deciduous trees and shrubs [9, 10].
Leaves that enter the stream systems are normally transported to short distances but are usually caught by the structures on the stream bed to form assemblages of leaf packs. After being trapped, these leaf packs are ‘processed’ in place by components of the stream aquatic community in a series of clear steps [11, 12]. Reduction in particle size from coarse particulate organic matter (CPOM) > 1 mm to fine particulate organic matter (FPOM) < 1 mm [13] is thought to occur generally by action of a variety of micro and macro consumers collectively called shredders [14]. Other factors that also contribute to fragmentation of organic material alongside microbial activities include physical factors such as current and abrasion [13].
The breakdown rates of leaves differ among species [15]. Due to this, breakdown rates for specific species can be influenced by various factors such as nutrient levels [16], stream, location in the stream, time of the year, activity of microbes, presence of macroinvertebrates and other stream specific factors. External nutrients of N and P imported and dissolved in streams also enhance leaf breakdown [17-19]. Leaf pack breakdown is a reflection of functional ecosystem integrity. This is because it links various stream systems such as leaf species, microbial activity, invertebrates, physical and chemical features of the stream [15]. Anthropogenic land use practices can also significantly alter rates of leaf breakdown. In agriculturally dominated or influenced streams which enrich streams result in faster breakdown rates. Conversely, in urbanized streams, more frequent disturbance increases fragmentation of leaves that enhances decomposition [20].
Generally, breakdown rates of detritus in fresh water lotic environments follow the decay model Mt = Moe-kt, where; t = time or degree days, Mt = mass at time t, Mo = mass at time 0, and; k = decay coefficient [13]. Mass therefore reduces with an exponential relationship.
In terms of comparative rates of aquatic detrital breakdown, allochthonous sources are somewhat recalcitrant and resistant to breakdown. This contrasts to relatively faster breakdown rates of autochthonous sources [3]. Some allochthonous sources are broken down and degraded by detrivory and decomposition while the rest enters detritus storage pool and remains in one place for a longer period of time or displaced downstream from its point of origin [11]. Rapidly growing species have leaves that break down more quickly while others have much tougher leaves that take more time to break down [21]. Increased organic carbon accompanied by low atmospheric exchange can make habitats to be temporarily anoxic with low oxygen levels <2 mgl-1 that can lead to death of aquatic animals. Organic materials in aquatic ecosystems may have anoxic zones associated with them. Decaying leaves have anoxic zones at their surfaces. This also occurs inside individual leaves including aggregates of leaves [21].
Diversification of forage crops utilization has resulted in their continuous uptake and adoption in Bomet region, accounting for over 5000 acres in Bomet district alone [22]. Being a high potential agricultural area with increasing human population, Bomet County is currently facing pressure on land use. The banks of River Nyangores have been encroached and cultivated with forage grasses notably Chloris gayana, Panicum coloratum and Pennisetum purpureum. The grasses are cultivated mostly to provide livestock feeds and control soil erosion. They are also grown on many steep slopes that constitute major hydrological pathways for surface erosion waters to the river. The grasses are intensively managed and occasionally cut and fed to livestock. This has generated large amounts of detritus that enter the stream waters by surface erosion, wind agent or natural leaf fall. Besides this, the river system is already facing dwindling water levels, high dissolved organic matter and silt load. The municipal water supply for Bomet town and its environs is abstracted from this river. However, the fate of these selected allochthonous grass detritus is unknown in terms of in-situ aquatic decomposition trends.
Global warming and climate change favour increased grass production. Research has indicated that increase in tropospheric CO2 fertilization will increase both plant production and resilience of grassland ecosystems to lower levels of precipitation [23]. This increased biomass production will inevitably result in higher rates of detritus generation. Investigating detritus decomposition can therefore provide a unique opportunity for formulating climate change adaptation approaches for forage agriculture among livestock farmers. This is most appropriate for forage production on river riparian zones including steep catchments.
The objectives of the study carried out between July 2013 and January 2014 were: (i) to determine in-situ decay coefficients for Pennisetum purpureum, Panicum coloratum and Chloris gayana in River Nyangores and (ii) to estimate detrital total phosphorus levels during incubation. It was hypothesized that no significant differences existed among the decay coefficients of the three grass species. The grasses were chosen for the study since they are dominantly cultivated in the riparian land of River Nyangores by farmers to control soil erosion and as a source of livestock forage, thereby generating detritus along the river banks.
2. MATERIALS AND METHODOLOGY
2.1. Study Area Location
Bomet County is located in the southern part of the expansive Rift Valley in Kenya. It covers an area of 593.4 km2 with a population density of 370 persons/km2 [24]. Geospatially it is within 0o 38’S-1o 03’S and 35o 01’E-35o 33’E, with an altitude in the range of 900 m to 2300 m above sea level [24]. Soils are mainly nitisols in association with ferrasols ranging from silt loam to clay. The rainfall is bimodal ranging from 1000 mm p.a-1400 mm p.a, with temperatures of 17 oC- 27 oC. There are 40,603 farm families in the area with an average farm holding of 5 acres [24]. River Nyangores is a mid-stream permanent river with its headwaters in Mau Forest from which it flows southwards. River Nyangores is approximately 63 km long and is a tributary of the Mara River. The river has a steep riverscape and partial alluvial stream bed. It exhibits some erosive breaches, a mostly meandering morphology with a depth of 0.7 m to 4.9 m. The river cuts through Bomet Township. The population growth rate of Bomet township is 2.4% p.a. according to Kenya government estimates.
2.2. Socio-economic Activities
Notable socio-economic activities in the wider river catchment include: Mixed farming activities mostly done in small scale to intensive systems of tea, maize, potatoes, horticulture, livestock and forages. Other activities are stone quarrying, soil mining, sand mining and industrial grain milling.
2.3. Selection of Deployment Locations on River Nyangores
Two locations were purposively selected: An upstream location (00°47’15.5”S, 035°20’56.3”E) and a downstream location (00°47’39.7”S, 035020’27.7”E). Both River locations have shallow riffles with water depth of 1.3 m. The upstream location features a deforested riparian zone while the downstream location is partially shaded with tree canopy. Bomet town lies between the upstream and downstream experimental locations.
The upstream location on River Nyangores was selected to represent part of the river segment not experiencing environmental urban perturbations. The downstream location was selected to represent part of the river segment perceived to experience environmental influences of urban settlement in Bomet township. Small-scale mixed cropping systems uniformly dominated the riversides beyond the two experimental locations.
2.4. Selection of Forage Farms
Forage farms for the collection of senesced grass for the three selected forage species namely: Boma Rhodes grass (Chloris gayana), Coloured guinea grass (Panicum coloratum), and elephant grass (Pennisetum purpureum) were selected through purposive sampling, along a stretch of 2 km on the riparian zone of river Nyangores. All the farms, from both sides of the river bank, were within 70 m of the river bank and between 12 to 24 months old since planting. Farm records were used to approximate the age of the forage farms. In total 12, 10 and 13 farms were selected purposively for Chloris gayana, Panicum coloratum and Pennisetum purpureum, after being assessed and deemed sufficient to be used to make a representative composite sample (Table 1).
A line level was used to approximate the slope of each of the forage farms. Farm slope for three points were taken and their average recorded as the percentage slope for the farm (Appendix A). The age of the forage farms of between 12 months to 24 months ensured that only grasses that adapted well to the riparian agro-ecological conditions were considered. At this age also, most of the forage farms had started accumulating detritus from natural leaf senescence. Proximity to river bank of < 2 m raises a high possibility of run-off that export the detriti, senesced or partially senesced grass to the lotic water system of River Nyangores due to the steep riverscape.
2.5. Sampling of Senesced Grass
Transect belts 1 m in width and quadrants of area 1 m2 were used for systematic sampling of senesced grass from forage farms for each of the grass species: Alternate systematic transects were used at 2 m intervals. Within every sampling region of 1 m2 quadrant enclosure along the transect belts, senesced grass and grass detritus without ground contact were collected by hand or clipped with a clean knife. A composite sample of all senesced grass and detritus was made for each grass species.
2.6. Drying of Senesced Grass
All collected senesced grass and detritus were pooled together separately to form a composite sample according to species. Every composite sample was placed in a wooden box (1 m x 0.6 m x 0.5 m) and fitted with a plastic screen. The grass samples were then dried in the sun and occasionally fluffed to facilitate aeration and drying [15]. The samples were solar-dried for 11 days until a relative constant mass was achieved. Four wooden boxes were used to dry composite sample for each grass species.
2.7. Mesh Bags, Leaf Packs and Stream Bed Anchors
Mesh bags of 5 mm pore size were used. The pore size of 5 mm is not too large to let away detritus from the bag while at the same time large enough to let in and out the macro and micro lotic consumers [15]. The total area of the mesh material used was 900 cm2 (30 cm x 30 cm). A total of 186 mesh bags were made. The dried grass samples were weighed in units of 5 g each. Each pre-weighed sample of 5 g was placed in a mesh bag to form a leaf pack. Leaf packs were tied with synthetic twines of three distinct colours in order to colour-code the species. Yellow twines were used on leaf packs containing Pennisetum purpureum, Light blue for Chloris gayana and dark blue for Panicum coloratum. A total of 62 leaf packs were assembled for every grass species. A total of 186 leaf packs were made. Stream bed anchors with racks were made using R6 (6 mm diameter steel) metal rods in order to secure the mesh bags on the stream bed against current. A total of six anchors were made each measuring 5 m long.
2.8. Deployment of Leaf Packs on the Stream Bed
Leaf packs were carefully placed in paper bags and transported to the river locations for deployment. At the upstream location, 30 leaf packs (10 leaf packs for each of the 3 grass species), were fastened on the circular racks on the anchor. Three anchors with leaf packs were assembled. Each anchor containing 30 leaf packs was lowered on to the stream bed and spaced 10 m apart, and placed on shallow riffle microhabitats. The shallow riffles were chosen to prevent leaf packs from being swept away during high current flows. Each of the three anchors were secured with pegs on the bank. Additionally, three leaf packs (one for each grass species designated for correcting mass losses) were lowered on the stream bed and withdrawn immediately. The withdrawn leaf packs were used to quality-control and check for possible mass losses during packaging and transport [15]. The three leaf packs were placed in a cool box, transported and refrigerated at 2°C. The leaf pack deployment procedure above was repeated at downstream location. This temperature, being lower than 4°C prevented any initial microbial action on samples. Besides this, the refrigeration temperature was objectively set above 0°C to avoid any potential embedment of samples on ice that can lead to breakages on removal for subsequent analysis.
2.9. Leaf Pack Withdrawal from Stream Bed
At the upstream location, six leaf packs (2 per anchor) for each of the three grass species were carefully withdrawn at intervals of 2 weeks for 10 weeks. The leaf packs were then placed in labeled paper bags, carried in a cool box and later refrigerated at 2 °C until they were processed. The procedure was repeated concurrently for the downstream withdrawals.
2.10. Processing Detritus for Mass Analysis
After two weeks of refrigeration at 2°C, the detritus from the leaf packs were processed per withdrawal. During processing, the detritus from each leaf pack was gently rinsed with distilled water to remove debris and salt using a 1 mm sieve. The 1 mm sieve was used in order to retain Coarse Particulate Organic Matter (>1 mm) that was not broken down to Fine Particulate Organic Matter (FPOM) or Dissolved Organic Matter (DOM) during incubation. The rinsed detritus was then carefully transferred to labeled paper bags and oven-dried for 24 hours at 50 °C and thereafter its mass in grams recorded. Detritus from all 180 leaf packs were processed. The processed detritus from each pack was milled and mixed to homogeneity. The dry mass was then converted to Ash-Free Dry Mass (AFDM) . For every withdrawal of 6 leaf packs per grass species, a mean % AFDM remaining was determined [1].
2.11. Measurement of River Temperature and Discharge
A minimum-maximum alcohol expansion type thermometer, Sixteen®, was used to record daily minimum and maximum water temperatures at 9.00 am, for 70 days at both upstream and downstream locations. One thermometer was secured on the deployment racks in the water at the two locations. For each day, the minimum and maximum temperatures were averaged to obtain the mean daily temperature (Table 2). Cumulative mean daily temperatures were used to get degree days [1, 13]. River discharge was determined as follows: daily water level readings were taken from a water level gauge at 8.30 am and 5.00 pm for the entire period of 10 weeks. The water level gauge used was positioned by the Water Resources Management Authority (WARMA) at a strategic point 10 m from the bridge over River Nyangores on the Narok-Bomet road. Each water level was converted to discharge in m3/s using hydrological constants provided by WARMA that are specific to the measurement point on the River Nyangores. The morning and evening discharge values were averaged to find the mean daily discharge.
2.12. Determination of In-Situ Processing Coefficient, k
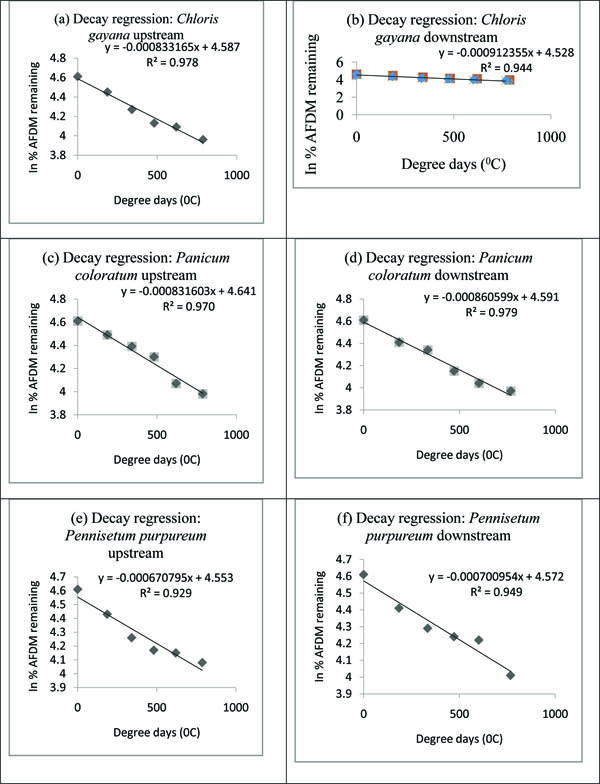
The decay model Mt = Moe-kt was log-transformed and the processing coefficient, k, determined by regressing the natural log (In) of mean % AFDM remaining (y-axis), on degree days of exposure (x-axis) using the AFDM of the handling loss leaf packs as 100% remaining for day 0. The negative slope of the regression line is equal to the processing coefficient, k [1, 15].
2.13. Determination of Total Phosphorus
Total phosphorus contents at pre-deployment and per withdrawal were determined using the molybdate calorimetric procedure with Jeenway® uv/vis spectrophotometer.
2.14. Phosphorus Drop and Percent Increase in Phosphorus Level in Withdrawn Litter
Phosphorus drop after week 2 of incubation was calculated by subtracting the P level at week 2 from the level before incubation. Percentage increase in P content at week 10 compared to unincubated grass litter for a particular location was calculated as follows;
% increase in P = %P at week 10- %P before incubation x 100
% P before incubation
2.15. Data Analysis
Data analysis was done using a computer XLSTAT-2014 programme. Analysis of covariance (p<5%) was used to compare decay coefficients since they are regression gradients. Pearson correlation (p<5%) was done for litter P contents and in-situ decay coefficients of detritus.
| Forage species | n | Slope (%) | River bank proximity (m) | Mean % grass total P | ||
|---|---|---|---|---|---|---|
| Min | Max | Min | Max | |||
| Chloris gayana | 12 | 5.29 | 12.94 | 1.1 | 2.3 | 2.83 |
| Pennisetum purpureum | 13 | 2.64 | 13.23 | 0.4 | 1.9 | 1.86 |
| Panicum Coloratum | 11 | 5.58 | 15.29 | 0.6 | 1.7 | 2.33 |
| Period | Mean River temperature (°C) | River discharge m3/s | ||
|---|---|---|---|---|
| Min | Max | Min | Max | |
| October, 2013 | 11.0 | 14.5 | 11.67 | 19.54 |
| November, 2013 | 6.5 | 13.0 | 5.69 | 8.15 |
| December, 2013 | 9.0 | 12.0 | 3.42 | 7.01 |
| January, 2014 | 10.0 | 12.5 | 4.48 | 9.02 |
3. RESULTS
3.1. Decay Coefficients and Ash Free Dry Masses (AFDM)
Temperature normalized in-situ processing coefficients were in the range 8.33165x10⁻⁴ dd-1-9.12355x10⁻⁴ dd-1 for Chloris gayana, 8.31603x10⁻⁴ dd-1-8.60599x10⁻⁴ dd-1 for Panicum coloratum and 6.70795x10⁻⁴ dd-1-7.00954x10⁻⁴ dd-1 for Pennisetum purpureum (Table 3 and Appendix B). Analysis of covariance (p<0.05) indicated significanct difference for the in-situ processing coefficients among the three grass species with higher decay rates recorded downstream than upstream. The decay rates were in the following ascending order: Pennisetum purpureum, Panicum coloratum and Chloris gayana.
| Grass species |
k-values (x 10-4 dd-1) |
(r2) |
k-values (x 10-4 dd-1) |
(r2) |
|---|---|---|---|---|
| Upstream | Downstream | |||
| Chloris gayana | 8.33165* | (0.978) | 9.12355* | (0.944) |
| Panicum coloratum | 8.31603* | (0.970) | 8.60599* | (0.979) |
| Pennisetum purpureum | 6.70795* | (0.929) | 7.00954* | (0.949) |
At both upstream and downstream river locations, Chloris gayana lost the highest AFDM compared to the pre-deployment mass. At the end of the 10-week decay period, Chloris gayana had only 2.216 g remaining. This represented 44.32% of the initial 5 g at deployment. This was followed by 2.783 g (55.66%) and 2.966 g (59.32%) for Panicum coloratum and Pennisetum purpureum respectively (Table 4)
| Withdrawal time (Weeks) | River location | Mean mass (g) remaining per withdrawal event for 6 replicates | ||
|---|---|---|---|---|
| Chloris gayana | Pennisetum purpureum | Panicum coloratum | ||
| 2 | Upstream | 4.283 | 4.366 | 4.600 |
| 2 | Downstream | 3.583 | 4.183 | 4.266 |
| 4 | Upstream | 3.633 | 3.783 | 4.250 |
| 4 | Downstream | 3.333 | 3.766 | 4.083 |
| 6 | Upstream | 3.366 | 3.566 | 3.833 |
| 6 | Downstream | 3.183 | 3.850 | 3.383 |
| 8 | Upstream | 3.083 | 3.350 | 3.100 |
| 8 | Downstream | 2.766 | 3.550 | 2.966 |
| 10 | Upstream | 2.766 | 3.150 | 2.800 |
| 10 | Downstream | 2.216 | 2.966 | 2.783 |
3.2. Total Phosphorus of Detritus During Decay
At week 10, the total P content for litter under decay at upstream rose from 2.83% to 3.14% for Chloris gayana, from 2.33% to 2.46% for Panicum coloratum and from 1.86% to 1.91% for Pennisetum purpureum. Corresponding P contents at downstream ranged from 2.83% to 3.34% for Chloris gayana, from 2.33% to 2.53% for Panicum coloratum and from 1.86% to 2.14% for Pennisetum purpureum (Table 5).
| Grass | Before incubation | Week 2 | Week 4 | Week 6 | Week 8 | Week 10 | |||||
|---|---|---|---|---|---|---|---|---|---|---|---|
| U | D | U | D | U | D | U | D | U | D | ||
| Chloris gayana | 2.83 | 2.66 | 2.75 | 2.81 | 2.9 | 3.04 | 2.91 | 3.07 | 3.11 | 3.14 | 3.34 |
| Panicum coloratum | 2.33 | 1.92 | 2.18 | 1.94 | 2.27 | 1.92 | 2.13 | 2.24 | 2.37 | 2.46 | 2.53 |
| Pennisetum purpureum | 1.86 | 1.74 | 1.58 | 1.72 | 1.73 | 1.81 | 1.79 | 1.76 | 1.84 | 1.91 | 2.14 |
All the grasses recorded a marginal drop in total phosphorus at week 2, and thereafter steadily rose with time of decay (Figs. 1 and 2).
| Grass species | Upstream | Downstream | Mean (for grass) |
|---|---|---|---|
| Chloris gayana | 10.9 | 18.0 | 14.5 |
| Panicum coloratum | 5.6 | 8.5 | 7.1 |
| Pennisetum purpureum | 2.7 | 15 | 8.9 |
| Mean (for river site) | 6.4 | 13.8 | -------- |
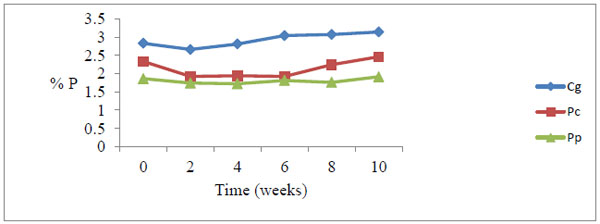 |
Fig. (1). Total phosphorus levels during decomposition upstream. There was a general increase in P levels peaking at week 10. Cg= Chloris gayana, Pc= Panicum coloratum, Pp= Pennisetum purpureum. |
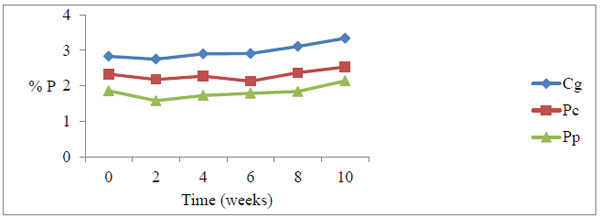 |
Fig. (2). Total phosphorus levels during decomposition downstream. There was a general increase in P levels peaking at week 10. Cg= Chloris gayana, Pc= Panicum coloratum, Pp= Pennisetum purpureum. |
The percentage upstream P build-up at 6.4% was lower than downstream at 13.8% Table 6. Pearson correlation showed a weak positive correlation between litter P and in-situ decay coefficients (p=0.787, r =0.143)
4. DISCUSSION
4.1. Decay Coefficients and Ash Free Dry Masses (AFDM)
Different allochthonous detritus normally have various in-situ processing coefficients [1, 14]. Chemical nutrient composition and leaf chemistry affects litter decomposition in river systems [13, 15, 25]. Surface area to volume ratio and P level in detritus also increase rates of aquatic breakdown [18, 26]. Studies have also shown that lower decay rates raise water biological oxygen demand and increase periods of water turbidity and hence reduce the rate at which food nutrients are distributed downstream to aquatic feeders [25]. The difference in-situ decay coefficient, k in the three species could be attributed to the differences in P nutrient contents (Table 5). Pennisetum purpureum showed the lowest in-situ processing coefficient which may be partly attributed to its morphology that features broader leaves that probably limit the surface area for microbial decomposition. Feeding preferences by aquatic feeders which enhance decay rates [11] probably appears to be in favour of Chloris gayana compared to the other grass energy sources.
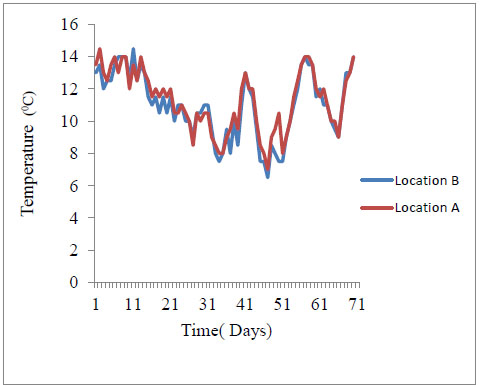
Pennisetum purpureum takes longer to decay hence it is likely to raise water biological oxygen demand especially during low flows on a time scale followed by Panicum coloratum and Chloris gayana. Longer decay rates also sustain periods of suspended solids and water turbidity. Nutrient spiraling and distribution downstream is also expected to depend on the rate of aquatic decay for three detritus grass species. Given similar hydrological properties of the river water including water current and discharge, nutrients supplied from Pennisetum purpureum source are comparatively distributed at the slowest rate downstream followed by Panicum coloratum and fastest by Chloris gayana. This way, Pennisetum purpureum is likely to provide food for lotic consumers for the longest time. The low river temperatures of river Nyangores may also explain the slow rates of breakdown (Appendix C). During the study period, river temperatures were generally low ranging from a minimum mean of 6.5 °C to a maximum mean of 14.5 °C (Table 1). Normally, higher breakdown rates of allochthonous detritus are actually realized at higher temperatures [27].
Changes in the physico-chemical conditions in river water cause variations in the aquatic decay rates along a river [15, 21]. Moreover, experimental additions of nitrates and phosphates leading to water nutrient enrichment have been noted to enhance detrital breakdown rates of grass [13, 28]. It has been observed that urban perturbations actually enhance rate of leaf breakdown [21]. Comparative aquatic decay rates between river locations have been used to investigate responses to influence of multiple land-use on stream structure and function [29]. Urbanized streams also bear immense impacts on their ecosystems [30], alter ecological functioning which is partly reflected in litter decay rates [31] and change biological integrity of streams [32]. It was demonstrated that blue joint grass (Calamagrostis canadensis) was a slow in-situ processor across six streams in the Kenai Peninsula, United States of America [13], where the decay variation was largely influenced by a gradient of nutrient enrichment of the streams.
Possible variations in physical and chemical water properties between the upstream and downstream locations probably explained the differences in breakdown rates. Low decay rate at the upstream location was likely due to less influence of urban pollution than downstream location. At the upstream location, the activities on the riparian areas and adjacent landscapes are mainly agricultural in nature. The human settlements are spatially scarce and removed from the actual riparian zone of River Nyangores. From a ground field reconnaissance assessment, apart from agricultural activities, there was no major environmental land use aspect that could impact significantly on the physico-chemical properties of water in River Nyangores.
There is a possibility of nutrient enrichment in River Nyangores due to the poor state of solid and liquid waste management in the town which the river passes through. The Bomet urban settlement lacks proper solid and liquid sanitation facilities. Run-off probably leads to nutrient water enrichment hence higher detrital breakdowns. From detrital P analysis, there was a higher P level in detritus withdrawn at downstream than upstream (Table 6). This indicates a possibility of higher P in the sediment and water downstream than upstream. Microbial agents in the water downstream may have the ecological advantage of additional energy flow in the form of nutrients. A field survey in the urban area close to the river showed a number of piled-up solid waste and open sewer lines for domestic liquid waste. The unprotected main municipal dumpsite slopes towards River Nyangores at 23% gradient. This is suspected to facilitate pollution of the river during run-off, hence a possible source of nutrient enrichment for the river.
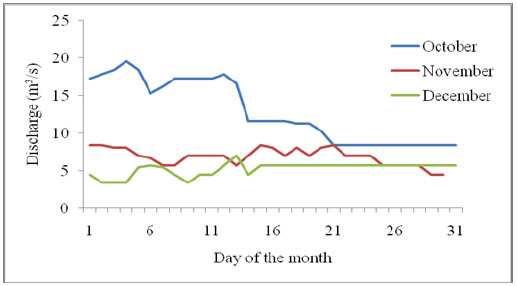
Instantaneous and occasional increased hydrologic flows at downstream can also contribute to higher in-situ processing coefficients of allochthonous detritus. For River Nyangores, this may arise as a consequence of the paved and open surfaces in the built-up areas of Bomet town that increases water yield. Firstly, surface water absorption in the urban area is lower since the land is built-up and much of the rain water is not harvested. This contrasts sharply with the cultivated landscapes upstream where more water absorption is expected than run-off, hence resulting in low water yield into the river. The discharge pattern which is enhanced in October and reducing towards January Table 2 and Appendix D is normal for River Nyangores and relates to the rainfall pattern of the area.
Secondly, the adjacent farms on the upstream riparian zones have soil conservation measures to control soil erosion. These measures include planting forages grasses on the river banks and making terraces which lower run-off and water velocity. In contrast, drainage channels in the urban environment lead all run-off unimpeded to the water course, with a possibility of increased river currents. This leads to higher physical abrasion of detritus downstream than upstream, hence forming a contributory factor to greater breakdown rates of detritus downstream. The changing decay rates of allochthonous detritus downstream is considered to be an environmental indicator of possible differences in ecological functioning along the river between the upstream and downstream experimental locations.
4.2. Total Phosphorus of Detritus During Decay
Phosphorus enters water systems from grass clippings through run-off [33, 34]. This forms an important aspect of phosphorus cycle and phosphorus budget in rivers. Phosphorus levels in litter undergoing decomposition increases with time due to microbial immobilization of P during litter colonization and decay [35]. Grass litter P content has been found to be positively correlated with litter breakdown [13]. Previous studies have shown that the initial loss of mass during decay process is accompanied by substantial P loss [36], together with other nutrients [37]
During the study, the marginal drop of P levels at week two compared to the initial levels among the three forage grasses is probably due to leaching of soluble P nutrient from the detritus within the first few days of the decay process (Figs. 1 and 2). The increase in P levels from week 2 to week 10 during decay process among the three litter species was probably due to microbial immobilization of P on litter substrate (Figs. 1 and 2)
Microbial agents notably bacteria and fungi continually colonize allochthonous energy sources in water and in the process immobilize nutrients on food substrates. In this study, the process of immobilization reached the peak at week 10, an observation likely to indicate an increasing microbial action with time. Differences in percent increases in P contents may indicate that P immobilization rates and levels are unique to different allochthonous detritus species and is therefore not a uniform phenomenon.
CONCLUSION
Decay coefficients have a potential to be adopted as a means of aquatic environmental monitoring. Though the three grass species are generally slow processors, it is recommended that for agro-ecologically sustainable forage agriculture on the riparian areas of River Nyangores, farmers may grow forage species in the following preferential order: Firstly Chloris gayana, followed by Panicum coloratum and finally Pennisetum purpureum. Further studies are required to explain variations in phosphorus immobilization among grass allochthonous species over time.
APPENDIX
Appendix A. Slopes in percentage gradient of forage farms adjacent to River Nyangores selected for the study.
| No. | Grass species | ||
|---|---|---|---|
| Chloris gayana | Pennisetum purpureum | Panicum coloratum | |
| 1 | 6.764706 | 8.823529 | 13.52941 |
| 2 | 10.58824 | 11.17647 | 14.70588 |
| 3 | 10.58824 | 5.588235 | 7.352941 |
| 4 | 9.117647 | 12.94118 | 7.647059 |
| 5 | 5.294118 | 7.176471 | 5.588235 |
| 6 | 8.529412 | 10.29412 | 14.41176 |
| 7 | 7.058824 | 2.647059 | 15.29412 |
| 8 | 5.882353 | 9.705882 | 7.058824 |
| 9 | 6.764706 | 8.823529 | 8.235294 |
| 10 | 8.235294 | 10.29412 | 9.705882 |
| 11 | 12.94118 | 12.35294 | --------- |
| 12 | 5.588235 | 13.23529 | ---------- |
| 13 | ------------- | 12.35294 | ----------- |
Appendix B. Decay regression graphs.
Appendix C. Temperature of River Nyangores taken for 70 days of incubation of detritus (Location B- downstream, Location A –upstream)
Appendix D. Discharge of River Nyangores over the study period October-December 2013.
CONFLICT OF INTEREST
The authors confirm that this article content has no conflict of interest.
ACKNOWLEDGEMENTS
Laboratory analysis was carried out at the Department of Environmental Sciences Laboratory, Kenyatta University, Kenya. Special gratitude is extended Ahmed Suboi for assistance with laboratory work.