
RESEARCH ARTICLE
Empirical Models for Estimating Tropospheric Radio Refractivity Over Osogbo, Nigeria
D. O. Akpootu1, *, A. M. Rabiu2
Article Information

Identifiers and Pagination:
Year: 2019Volume: 13
First Page: 43
Last Page: 55
Publisher Id: TOASCJ-13-43
DOI: 10.2174/1874282301913010043
Article History:
Received Date: 20/03/2019Revision Received Date: 30/08/2019
Acceptance Date: 18/09/2019
Electronic publication date: 15/11/2019
Collection year: 2019
open-access license: This is an open access article distributed under the terms of the Creative Commons Attribution 4.0 International Public License (CC-BY 4.0), a copy of which is available at: https://creativecommons.org/licenses/by/4.0/legalcode. This license permits unrestricted use, distribution, and reproduction in any medium, provided the original author and source are credited.
Abstract
Background:
Estimation of tropospheric radio refractivity is significant in the planning and design of terrestrial communication links.
Methods:
In this study, the monthly average daily atmospheric pressure, relative humidity and temperature data obtained from the National Aeronautics and Space Administration (NASA) during the period of twenty two years (July 1983 - June 2005) for Osogbo (Latitude 7.47 0 N, Longitude 4.29 0 E, and 302.0 m above sea level) were used to estimate the monthly tropospheric radio refractivity. The monthly average daily global solar radiation with other meteorological parameters was used to developed one, two, three and four variable correlation(s) tropospheric radio refractivity models for the location. The accuracy of the proposed models are validated using statistical indicator of coefficient of determination (R2), Mean Bias Error (MBE), Root Mean Square Error (RMSE), Mean Percentage Error (MPE), Nash - Sutcliffe Equation (NSE) and Index of Agreement (IA).
Results:
In each case one empirical model was recommended based on their exceptional performances after ranking, except for the two variation correlations with two empirical models. The recommended models were further subjected to ranking from which the three variable correlations model that relates the radio refractivity with the absolute temperature, relative humidity and global solar radiation was found more suitable for estimating tropospheric radio refractivity for Osogbo with R2 = 100.0%, MBE = -0.2913 N-units, RMSE = 0.3869 N-units, MPE = 0.0811%, NSE = 99.9999% and IA = 100.00%.
Conclusion:
The newly developed recommended models (Equations 16c, 17d, 17f, 18d and 19) can be used for estimating daily and monthly values of tropospheric radio refractivity with higher accuracy and has good compliance to highly varying climatic conditions for Osogbo and regions of similar climatic information.
1. INTRODUCTION
Refractivity is defined as the physical property of a medium as determined by its index of refraction and it is responsible for the different phenomena in radio wave propagation which comprises of refraction and fading, ducting and scintillation, range and elevation errors in radar acquisition [1].
The way by which radio signals travel from the transmitter to receiver is of great importance when constructing a radio communication network. This is governed to a reasonable extent, by the state of the atmosphere through which the waves traverse. Thus, the study on the use of atmospheric parameters with to radio communication requires vital information of radio refractivity to characterize the atmosphere for terrestrial and Earth - satellite communication purposes [2]. The variations in the refractive index of the troposphere are small but, nonetheless, play an important role in radio wave propagation.
There are two main atmospheric layers that are of interest from a radio communication perspective. The first is the troposphere (lower atmosphere) which extends from the Earth surface to an altitude of about 10 km at the earth poles and 17 km at the equator and tends to affect radio frequencies above 30 MHz [3]. The second is the ionosphere which is a region that extends from around 60 km up to 700 km producing ions and free electrons which affect radio signals at certain frequencies; typically those below 30 MHz [4]. In radio propagation study, the troposphere is considered as a dielectric medium. The variations of the refractive index of the troposphere are small but nevertheless play significant role in radio wave propagation [5].
A ratio of radio wave propagation velocity in free space and its velocity in an atmosphere is an atmospheric radio refractive index n. Refractive index is not stable in the atmosphere and its space-time distribution results in scattering, sub-refraction, super-refraction, ducting, and absorption phenomena [6]. Knowledge of radio refractivity is vital in the design of telecommunication systems. It depends on the temperature, pressure, and humidity of air [7]. The characterization of tropospheric radio refractivity variability has great significance to radio communication, aero-space, environmental monitoring, disaster forecasting, etc. [8]. For example, worse propagation conditions lead to increased fading on communication links and consequently decreased power levels at receiver [8]. The method for determination of radio refractivity-value has been proposed by International Telecommunication Union (ITU) [9] and was considered as the measured tropospheric radio refractivity in this study.
In designing a wireless communication system, the spatial and diurnal variation of radio refractive index is paramount. In wireless network planning and optimization, radio wave propagation prediction modelling is an important tool [10, 11-20] carried out several studies on radio refractivity for different regions and climates using measured local meteorological data in Nigeria and various parts of the world. The results of their investigations revealed that the local climate has a substantial influence on the radio refractivity and consequently on the transmitted radio signals. More recently, Ajileye [21] investigated new linear meteorological models most suitable for estimation of surface refractivity using 40 years data downloaded from Modern-Era Retrospective analysis for Research and Application (MERRA - 2) for six locations defined by different climatic conditions over Nigeria, namely Yenagoa, Abakaliki, Ibadan, Anyigba, Jalingo and Sokoto, using statistical indicators of correlation coefficient and standard deviation, Ajileye [21] reported that the estimation of surface refractivity from the new linear meteorological models was found to be best as a function of temperature and relative humidity in the south and a function of relative humidity in the north. Linear meteorological models as a function of relative humidity and temperature were best suitable for stations in the south with minimum correlation of 0.98 while linear expressions as a function of relative humidity were only best suitable for the stations in the north with minimum correlation of 0.96.
The purpose of this study is to develop different sets of variable correlation models capable of estimating tropospheric radio refractivity for Osogbo and its environs. In this model, the data of meteorological parameters of measured monthly average daily atmospheric pressure, absolute temperature, relative humidity and global solar radiation are used. The aim is to identify the most appropriate model(s) for estimating tropospheric radio refractivity for the location under study.
1.1. Study Area
Osogbo, is a city in Nigeria and the capital of Osun State. It is located at latitude 7.47°N and longitude 4.29°E in Southwest of Nigeria Fig. (1). It has a population density of 350-500 people/m2 [22]. The population of Osogbo grew from 106,386 to 155, 507 between 1991- 2006 [23].
It is bordered by Ogun State to the south, Kwara State to the north, Oyo State to the west and Ekiti and Ondo State to the east. The state is within the tropical rain forest with abundance of resources. Minerals resources found in the state include gold, kaolin and others which are being extracted for the benefit of the state and the people. It is around 88 kilometers by road northeast of Ibadan (capital of Oyo state). It is also 100 kilometers by road south of Ilorin (capital of Kwara state) and 115 kilometers northwest of Akure (capital of Ondo state). It is about 48 km from Ife, 32 km from Ilesa, 46 km from Iwo, 48 km from Ikire and 46 km from Ila-Orangun; The state also has many hills in towns like Ikirun, Iragbiji, Ilesha, Ikire and Ile-Ife. These hills were fortresses for the people during the Yoruba wars and the Fulani expansionist period. Presently, they serve as beautiful sceneries and landscapes to look at when visiting or passing through these towns.
Osogbo experiences a warm humid tropical climate, with two distinct seasons, the rainy and dry seasons. The rainy season lasts for about seven months i.e, from April and ends in October while the dry season lasts from November - March. In Osogbo, the rainy season is warm, oppressive, and overcast and the dry season is hot, muggy, and partly cloudy. Over the course of the year, the temperature typically varies from 65°F to 93°F and is rarely below 60°F or above 98°F. Based on the beach/pool score, the best time of year to visit Osogbo for hot-weather activities is from late November to early February. Osogbo is characterized by Guinea Savannah climate with annual rainfall range of 1100-1500 mm. It has an average daily temperature of 26°C and an average annual relative humidity of 83%. However, the relative humidity can be up to 90% during the rainy season.
2. METHODOLOGY
The measured daily climatic data of atmospheric pressure, relative humidity temperature and global solar radiation employed in this study were obtained from the National Aeronautics and Space Administration (NASA) atmospheric science data centre under Surface meteorology and Solar Energy. The daily averaged data were aggregated to monthly data. The study area under investigation was Osogbo (Latitude 7.47 0 N, Longitude 4.29 0 E and altitude 302.0 m above sea level). To avoid possible misleading indications related to year to year variation in weather conditions, the period under investigation was twenty two years (July 1983 - June 2005) so as to obtain a good climatological average. The quality assurance of the
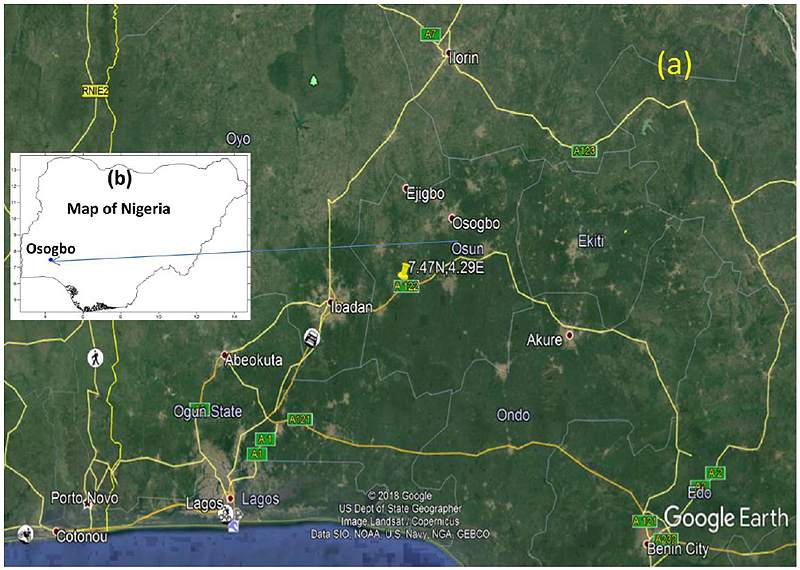 |
Fig. (1). (a) Google map showing the study area (b) Map of Nigeria showing the study area. |
meteorological measurements was determined by careful examination of the overall consistency of the monthly average of the climatic parameters used in the study area.
The refractive index, n of the atmosphere is dependent upon three factors, these are, atmospheric pressure, temperature and humidity (water vapour content). The value of the refractive index, n, is very close to unity (varying between 1.000250 and 1.000400) at or near the Earth’s surface and changes in this value are very small in time and in space. With the aim of making them more noticeable, the refractive index, n of air is measured by a quantity called the radio refractivity, N which is related to the refractive index, n as (Eq. 1) [9, 24].
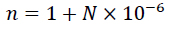 |
(1) |
The radio refractivity, N, is a dimensionless quantity, it is expressed in N-units. Therefore from equation (1) it is easy to deduce that a typical range of N will be between 250 and 400 N-units. In terms of meteorological parameters, the International Telecommunication Union (ITU) has recommended the radio refractivity, N, to be expressed as (Eq. 2) [9].
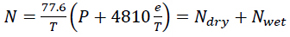 |
(2) |
with the “dry term” of radio refractivity given by (Eq. 3):
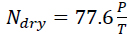 |
(3) |
and the “wet term” of radio refractivity given by (Eq. 4):
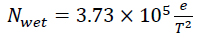 |
(4) |
where P is the atmospheric pressure (hPa), T is the absolute temperature K and e is the water vapour pressure (hPa). The dry term is due to non-polar nitrogen and oxygen molecules. It is proportional to pressure, P, and therefore, related to the air density. The wet term is proportional to vapor pressure and dominated by polar water contents in the troposphere.
It was mentioned in [9] and [24] that the expression (2) may be used for all radio frequencies; for frequencies up to 100 GHz, the error is less than 0.5%. At sea level, the average value of N ≈ 315 [9] is used.
The relationship between water vapour pressure, e, and relative humidity is given by the following expression (Eq. 5) [9]:
 |
(5) |
where (Eq. 6)
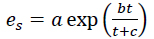 |
(6) |
where H is the relative humidity (%), t is the Celsius temperature (°C) and es is the saturation vapour pressure (hPa) at temperature (°C). The values of the coefficients a, b and c (for water and ice) are presented in [9]. In this study, the values of the coefficients for water were adopted and given as a = 6.1121 b = 17.502 and c = 240.97 and are valid between -20° to +50° with an accuracy of ±0.20%. The radio refractivity, N, also decreased exponentially in the troposphere with height [9].
The accuracy of the estimated values was tested by calculating the Mean Bias Error (MBE) (Eq. 7), Root Mean Square Error (RMSE) (Eq. 8), Mean Percentage Error (MPE) (Eq. 9) and t-test. The expressions for the MBE, RMSE and MPE according to [25] are given by :
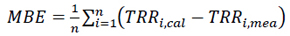 |
(7) |
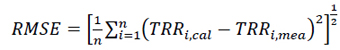 |
(8) |
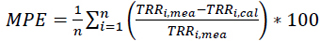 |
(9) |
The Nash-Sutcliffe equation (NSE) is given by the expression (Eq. 10:)
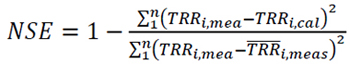 |
(10) |
The Index of Agreement (IA) is given as (Eq. 11)
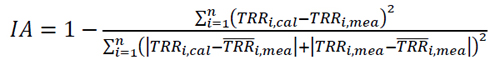 |
(11) |
From equations (7-11), TRRi,mea,,TRRi,cal,, and n are the ith measured and ith calculated values of daily tropospheric radio refractivity and the total number of observations, respectively. [26, 27] recommended that a zero value for MBE is ideal and a low RMSE is desirable. Additionally, the smaller the value of the MBE, RMSE and MPE, the better the model’s performance. The RMSE test provides information on the short-term performance of the studied model as it allows a term - by - term comparison of the actual deviation between the calculated values and the measured values. The MPE test gives information on the long term performance of the examined regression equations; positive MPE and MBE values provide the average amount of overestimation of the calculated values, while the negative values give underestimation. For better performance of the model, a low value of MPE is desirable and the percentage error between -10% and +10% is considered acceptable [28]. Similarly, for better data modelling, the coefficient of determination, R2 should approach 1 (100%) as closely as possible [29, 30]. A model is more efficient when NSE is closer to 1 (100%) [27]. Similarly, for better data modelling, the coefficient of determination R2 should approach 1 (100%) as close as possible. Though, it has been cited in a study by [31] that the Index of Agreement (IA) was proposed by [32] as an alternative to and. According to him, IA is a relative and bound measure, while R and R2 are not consistently related to the accuracy of prediction. [33] observed that the “high” or the statistically significant values of R and R2 may be misleading as they are often unrelated to the difference between measured (TRRi,mea,,) and calculated (TRRi,cal,,) values. IA determines the extent to which mean magnitude TRRi,mea,, is related to the predicted/calculated deviations Hi,mea,, of and allows sensitivity towards differences in TRRi,mea,, and TRRi,cal,, as well as the proportional changes [34]. IA is a statistical measure of the correlation of the measured and predicted solar radiation. When IA=1 or 100%, it indicates a perfect agreement between the model estimations and the direct measurements of the parameters in the study; when IA = 0, it indicates that the measured and estimated values are not in a good agreement. MBE and RMSE are in N-units. R2, MPE, NSE and IA are in percentage (%).
The proposed tropospheric radio refractivity based models developed in this study are
One Variable Correlation Radio Refractivity Models (Eq. 12a-12d):
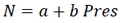 |
(12a) |
 |
(12b) |
 |
(12c) |
 |
(12d) |
Two Variable Correlations Radio Refractivity Models(Eq. 13a-13f)
 |
(13a) |
 |
(13b) |
 |
(13c) |
 |
(13d) |
 |
(13e) |
 |
(13f) |
Three Variable Correlations Radio Refractivity Models(Eq. 14a-14d)
 |
(14a) |
 |
(14b) |
 |
(14c) |
 |
(14d) |
Four Variable Correlations Radio Refractivity Model(Eq. 15):
 |
(15) |
The constants a, b,c,d and e are the tropospheric radio refractivity empirical constants; the meteorological parameters Press,T,RH and GSR are the monthly average daily atmospheric pressure in hPa, absolute temperature in Kelvin (K), relative humidity in percentage (%) and global solar radiation in MJm-2day-1, respectively Table (1). The N has been previously defined. It is worthy of note that the global solar radiation was converted from kWh/m2 to MJm-2day-1 using 1 kWh/m2 = 3.6 MJm-2day-1
| Month | Pres (hPa) | RH (%) | T (K) | GSR (MJm -2 day -1 ) |
|---|---|---|---|---|
| Jan | 985.0606 | 54.6957 | 298.9880 | 20.04941 |
| Feb | 984.7269 | 61.2357 | 299.2670 | 20.66168 |
| Mar | 984.0770 | 77.7766 | 298.8238 | 20.38582 |
| Apr | 984.1336 | 82.8942 | 298.6721 | 19.20785 |
| May | 985.4650 | 83.8966 | 298.5238 | 18.08382 |
| Jun | 987.3211 | 85.4241 | 297.6988 | 16.24195 |
| Jul | 988.0842 | 85.5587 | 296.7746 | 14.00205 |
| Aug | 988.1994 | 84.7541 | 296.6562 | 13.43064 |
| Sep | 987.1414 | 85.5913 | 297.0849 | 14.62353 |
| Oct | 986.3157 | 84.4151 | 297.3953 | 16.62408 |
| Nov | 985.4994 | 79.5991 | 297.5371 | 18.66065 |
| Dec | 985.3169 | 63.8901 | 298.1115 | 19.33749 |
| Average | 985.9451 | 77.4776 | 297.9611 | 17.6091 |
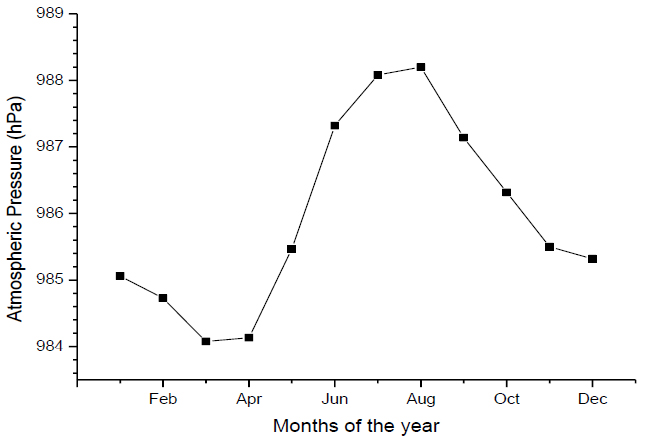 |
Fig. (2). Monthly variation in Atmospheric pressure for Osogbo. |
3. RESULTS AND DISCUSSION
Fig. (2) shows the monthly variation in Atmospheric pressure for Osogbo. It was observed that the highest atmospheric pressure was in the month of August with 988.1994 hPa and the lowest value was in the month of March with 984.0770 hPa.
Fig. (3) shows the monthly variation in relative humidity for Osogbo. It was observed that the highest relative humidity was in the month of September with 85.5913% and the lowest value was in the month of January with 54.6957%.
Fig. (4) shows the monthly variation in absolute temperature for Osogbo. It was observed that the highest absolute temperature was in the month of February with 299.2670 K and the lowest value was in the month of August with 296.6562 K.
Fig. (5) shows the monthly variation in global solar radiation for Osogbo. It was observed that the highest global solar radiation was in the month of February with 20.66168 MJm -2 day -1 and the lowest value was in the month of August with 13.43064 MJm -2 day -1 .
Fig. (6) shows the monthly variation in radio refractivity for Osogbo. It was observed that the highest radio refractivity was in the month of May with 370.9779 N-units and the lowest value was in the month of January with 332.3642 N-units.
Fig. (7) shows the annual variation in radio refractivity for Osogbo. It was observed that the annual radio refractivity was in the year 2003 with 364.6849 N-units and the lowest value was in the year 1992 with 353.203 N-units.
The evaluated empirical regression tropospheric radio refractivity based models with their respective empirical constants developed in this study are
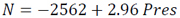
One Variable Correlation Radio Refractivity Models (Eq. 16a-16d)
 |
(16a) |
 |
(16b) |
 |
(16c) |
 |
(16d) |
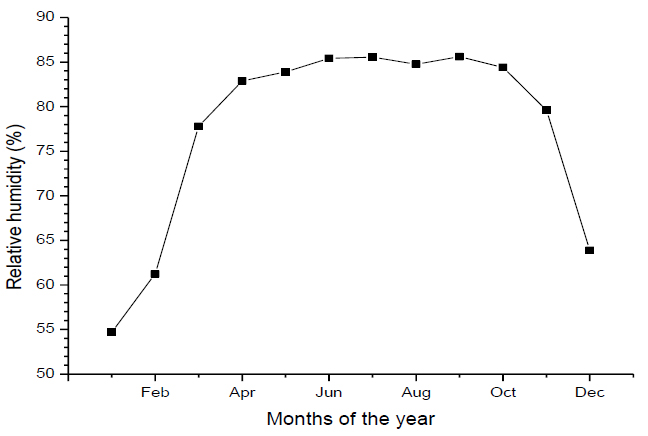 |
Fig. (3). Monthly variation in relative humidity for Osogbo. |
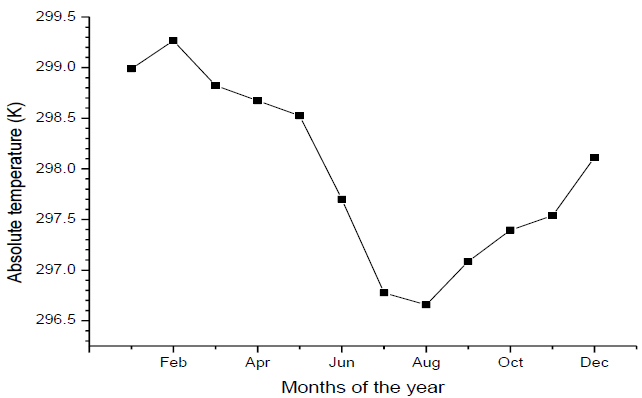 |
Fig. (4). Monthly variation in Absolute temperature for Osogbo. |
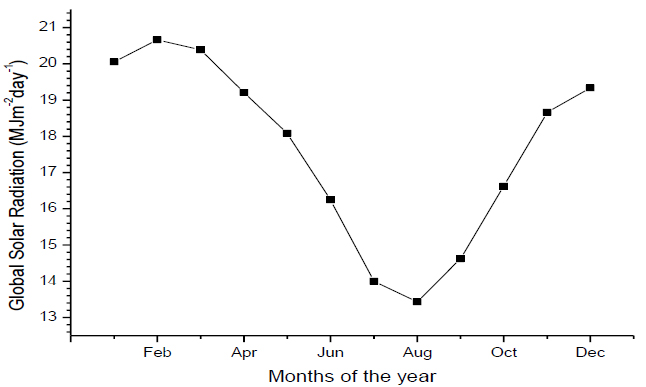 |
Fig. (5). Monthly variation in Global solar radiation for Osogbo. |
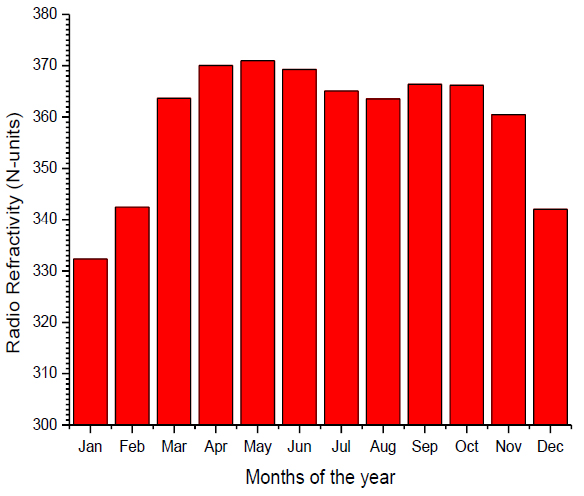 |
Fig. (6). Monthly variation in radio refractivity for Osogbo. |
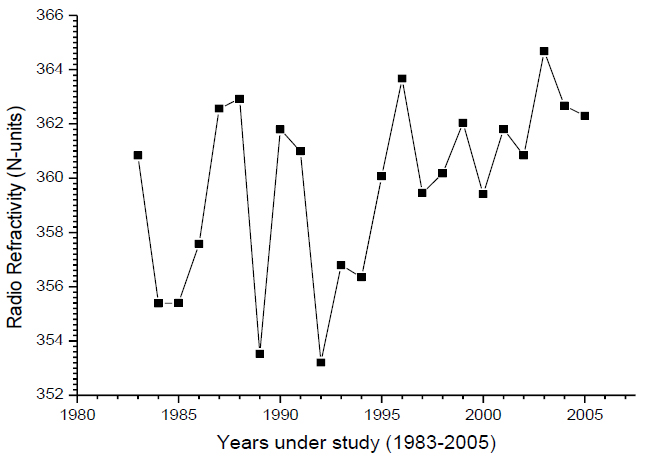 |
Fig. (7). Annual variation in radio refractivity for Osogbo. |
Two Variable Correlations Radio Refractivity Models (Eq. 17a-17f):
 |
(17a) |
 |
(17b) |
 |
(17c) |
 |
(17d) |
 |
(17e) |
 |
(17f) |
Three Variable Correlations Radio Refractivity Models (Eq. 18a-18d):
 |
(18a) |
 |
(18b) |
 |
(18c) |
 |
(18d) |
Four Variable Correlations Radio Refractivity Model (Eq. 19):
 |
(19) |
Table 2 gives the outline of the different statistical tests used and ranking of the one variable correlation radio refractivity based models for Osogbo. Based on the R2 the model, equation 16c has the highest value of 94.6% and was considered the best model. Based on the MBE, the model, equation 16d has the lowest value with underestimation of 0.0311 N-units in the estimated value and was considered the best model. Based on the RMSE the model, equation 16c has the lowest value with 2.8806 N-units and was considered the best model. Based on the MPE, regardless of the observed overestimation and underestimation exhibited by the models, they all fall within the acceptable range (MPE≤±10%) with the model, equation 16c having the lowest value with underestimation of 0.0058% in the estimated value and was considered the best model. Based on the NSE and IA the model, equation 16c has the highest values of 99.9930% and 99.9982% respectively and was considered the best model.
The ranking of the models (Table 3) was done based on the validation of the models (Table 2). The total ranks obtained by the different models ranged from 7 to 24. Based on the overall results the model, equation 16c which relates the radio refractivity with relative humidity, was found to be the best and the most suitable model for estimating tropospheric radio refractivity based on the one variable correlation for the area under study.
| Models | R2 | MBE | RMSE | MPE | NSE | IA |
|---|---|---|---|---|---|---|
| Eqn.16a | 11.0 | -2.9696 | 12.0094 | 0.7183 | 99.8779 | 99.9692 |
| Eqn.16b | 22.3 | -0.5024 | 10.8893 | 0.0450 | 99.8996 | 99.9748 |
| Eqn.16c | 94.6 | -0.0426 | 2.8806 | 0.0058 | 99.9930 | 99.9982 |
| Eqn.16d | 27.7 | -0.0311 | 10.4910 | -0.0799 | 99.9068 | 99.9767 |
| Models | R2 | MBE | RMSE | MPE | NSE | IA | Total |
|---|---|---|---|---|---|---|---|
| Eqn.16a | 4 | 4 | 4 | 4 | 4 | 4 | 24 |
| Eqn.16b | 3 | 3 | 3 | 2 | 3 | 3 | 17 |
| Eqn.16c | 1 | 2 | 1 | 1 | 1 | 1 | 7 |
| Eqn.16d | 2 | 1 | 2 | 3 | 2 | 2 | 12 |
Fig. (8) shows the comparison between the measured and recommended estimated radio refractivity based on one variable correlation model for Osogbo, Nigeria. The estimated radio refractivity model, equation 16c overestimated the measured radio refractivity in its estimated values in the months of January and from July to December and underestimated the measured radio refractivity in the months from February to June.
Table 4 gives the outline of the different statistical tests used and ranking of the two variable correlations radio refractivity based models for Osogbo. Based on the R2 the model, equation 17d has the highest value of 100.0% and was considered the best model. Based on the MBE, the model, equation 17f has the lowest value with overestimation of 0.1343 N-units in the estimated value and was considered the best model. Based on the RMSE the model, equation 17d has the lowest value with 0.4988 N-units and was considered the best model. Based on the MPE, regardless of the observed overestimation and underestimation displayed by the models, they all fall within the acceptable range (MPE≤±10%) with the model, equation 17f having the lowest value with underestimation of 0.0385% in the estimated value and was considered the best model. Based on the NSE and IA the model, equation 17d has the highest values of 99.9998% and 99.9645% respectively and was considered the best model.
The ranking of the models (Table 5) was done based on the validation of the models (Table 4). The total ranks obtained by the different models ranged from 10 to 35. Based on the overall results the models, equation 17d and 17f which relates the radio refractivity with absolute temperature and relative humidity and also with relative humidity and global solar radiation were found to be the best and most suitable models for estimating tropospheric radio refractivity based on the two variable correlations for the area under study.
| Models | R2 | MBE | RMSE | MPE | NSE | IA |
|---|---|---|---|---|---|---|
| Eqn.17a | 26.1 | 5.5419 | 11.9694 | -1.6342 | 99.8787 | 99.9701 |
| Eqn.17b | 98.6 | 0.3196 | 1.4904 | -0.0905 | 99.9981 | 99.9995 |
| Eqn.17c | 57.1 | -2.8103 | 8.5564 | 0.7300 | 99.938 | 99.9844 |
| Eqn.17d | 100.0 | 0.4177 | 0.4988 | -0.1162 | 99.9998 | 99.9999 |
| Eqn.17e | 27.9 | -7.3584 | 12.8025 | 1.9618 | 99.8612 | 99.9645 |
| Eqn.17f | 98.8 | 0.1343 | 1.3719 | -0.0385 | 99.9984 | 99.9996 |
| Models | R2 | MBE | RMSE | MPE | NSE | IA | Total |
|---|---|---|---|---|---|---|---|
| Eqn.17a | 6 | 5 | 5 | 5 | 5 | 5 | 31 |
| Eqn.17b | 3 | 2 | 3 | 2 | 3 | 3 | 16 |
| Eqn.17c | 4 | 4 | 4 | 4 | 4 | 4 | 24 |
| Eqn.17d | 1 | 3 | 1 | 3 | 1 | 1 | 10 |
| Eqn.17e | 5 | 6 | 6 | 6 | 6 | 6 | 35 |
| Eqn.17f | 2 | 1 | 2 | 1 | 2 | 2 | 10 |
Fig. (9) shows the comparison between the measured and recommended estimated radio refractivity based on two variable correlations models for Osogbo, Nigeria. The radio refractivity model, equation 17d overestimated the measured radio refractivity and equation 17f in the months from January to September, while the model, equation 17f overestimated the measured radio refractivity and equation 17d in the months from October to December and underestimated the measured radio refractivity and equation 17d in the months of January, February, April to June and in August. The models equation 17d and 17f overestimated the measured radio refractivity in the month of March, July, October and November. The pattern of variation in the measured and estimated radio refractivity models follows similar trend except the slight noticeable difference in the model equation 17f in the months of April - June and October - November.
Table 6 gives the outline of the different statistical tests used and ranking of the three variable correlations radio refractivity based models for Osogbo. Based on the R2 the models, equation 18a and 18d have the highest value of 100.0% and are considered the best model. Based on the MBE, the model, equation 18d has the lowest value with underestimation of 0.2913 N-units in the estimated value and was considered the best model. Based on the RMSE the model, equation 18d has the lowest value with 0.3869 N-units and was considered the best model. Based on the MPE, regardless of the observed overestimation and underestimation exhibited by the models, they all fall within the acceptable range (MPE≤±10%) with the model, equation 18d having the lowest value with underestimation of 0.0811% in the estimated value and was considered the best model. Based on the NSE and IA the model, equation 18d has the highest values of 99.9999% and 100.0000% respectively and was considered the best model.
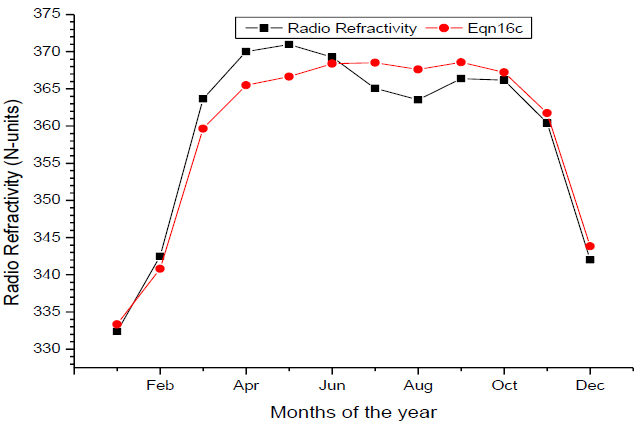 |
Fig. (8). Comparison between the measured and recommended estimated radio refractivity based on one variable correlation model for Osogbo, Nigeria. |
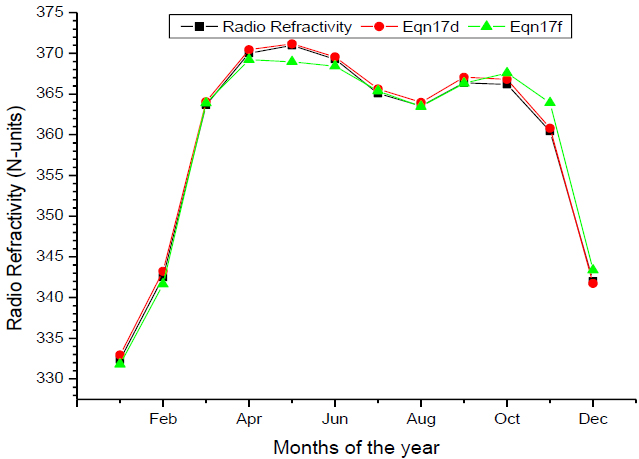 |
Fig. (9). Comparison between the measured and recommended estimated radio refractivity based on two variable correlations models for Osogbo, Nigeria. |
The ranking of the models (Table 7) was done based on the validation of the models (Table 6). The total ranks obtained by the different models ranged from 6 to 23. Based on the overall results the model, equation 18d which relates the radio refractivity with the absolute temperature, relative humidity and global solar radiation was found to be the best and most suitable model for estimating tropospheric radio refractivity based on the three variable correlations for the area under study.
| Models | R2 | MBE | RMSE | MPE | NSE | IA |
|---|---|---|---|---|---|---|
| Eqn.18a | 100.0 | 1.1635 | 1.1940 | -0.3238 | 99.9988 | 99.9997 |
| Eqn.18b | 98.8 | 1.9757 | 2.3946 | -0.5515 | 99.9951 | 99.9988 |
| Eqn.18c | 57.1 | -8.7751 | 11.9299 | 2.3927 | 99.8795 | 99.9691 |
| Eqn.18d | 100.0 | -0.2913 | 0.3869 | 0.0811 | 99.9999 | 100.00 |
Fig. (10) shows the comparison between the measured and recommended estimated radio refractivity based on three variable correlations model for Osogbo, Nigeria. The radio refractivity model, equation 18d slightly underestimated the measured radio refractivity in the months of January, March to August and in December. The model, equation 18d and the measured radio refractivity has almost same values in the months of February and from September to November. The pattern of variation follows similar trend with good fitting.
| Models | R2 | MBE | RMSE | MPE | NSE | IA | Total |
|---|---|---|---|---|---|---|---|
| Eqn.18a | 1 | 2 | 2 | 2 | 2 | 2 | 11 |
| Eqn.18b | 2 | 3 | 3 | 3 | 3 | 3 | 17 |
| Eqn.18c | 3 | 4 | 4 | 4 | 4 | 4 | 23 |
| Eqn.18d | 1 | 1 | 1 | 1 | 1 | 1 | 6 |
Table 8 gives the outline of the different statistical tests used for the four variable correlation radio refractivity based model for Osogbo. The R2, MBE, RMSE, MPE, NSE and IA are 100.0%, 0.4422 N-units, 0.5113 N-units, -0.1237%, 99.9998% and 99.9999% respectively. The model, equation 19 which relates the radio refractivity with the four variables was found suitable for estimating tropospheric radio refractivity based on the four variable correlations for the area under study.
| Model | R2 | MBE | RMSE | MPE | NSE | IA |
|---|---|---|---|---|---|---|
| Eqn.19 | 100.0 | 0.4422 | 0.5113 | -0.1237 | 99.9998 | 99.9999 |
Fig. (11) shows the comparison between the measured and estimated radio refractivity based on four variable correlations models for Osogbo, Nigeria. The radio refractivity model, equation 19 slightly overestimated the measured radio refractivity in its estimated values throughout the period under investigation except in the month of December where they have almost similar value. The pattern of variation depicts similar trend with good fitting.
Table 9 gives the outline of the different statistical tests used and ranking of the recommended radio refractivity based models for Osogbo. Based on the R2 the models; equation 17d, 18d and 19 have the highest value of 100.0% and are considered as the best models. Based on the MBE, the model, equation 16c has the lowest value with underestimation of 0.0426 N-units in the estimated value and is considered the best model. Based on the RMSE the model, equation 18d has the lowest value with 0.3869 N-units and is considered the best model. Based on the MPE, regardless of the observed overestimation and underestimation exhibited by the models, they all fall within the acceptable range (MPE≤±10%) with the model, equation 16c having the lowest value with overestimation of 0.0058% in the estimated value and was considered the best model. Based on the NSE and IA the model, equation 18d has the highest values with 99.9999% and 100.0000% respectively.
| Models | R2 | MBE | RMSE | MPE | NSE | IA |
|---|---|---|---|---|---|---|
| Eqn.16c | 94.6 | -0.0426 | 2.8806 | 0.0058 | 99.9930 | 99.9982 |
| Eqn.17d | 100.0 | 0.4177 | 0.4988 | -0.1162 | 99.9998 | 99.9999 |
| Eqn.17f | 98.8 | 0.1343 | 1.3719 | -0.0385 | 99.9984 | 99.9996 |
| Eqn.18d | 100.0 | -0.2913 | 0.3869 | 0.0811 | 99.9999 | 100.0000 |
| Eqn.19 | 100.0 | 0.4422 | 0.5113 | -0.1237 | 99.9998 | 99.9999 |
The ranking of the models (Table 10) was done based on the validation of the models (Table 9). The total ranks obtained by the different models ranged from 10 to 18. Based on the overall results the model, equation 18d which relates the radio refractivity with the absolute temperature, relative humidity and global solar radiation (three variable correlations) was found to be the best and most suitable model for estimating tropospheric radio refractivity for the area under study. However, for simplicity the one variable correlation model that relates the radio refractivity with the relative humidity can be used for tropospheric radio refractivity estimation as it performs best based on the MBE and MPE. The model can be used if relative humidity is the only available data. The two variable correlation model that relates the temperature and relative humidity was found to be more suitable in Osogbo located in southern part of Nigeria, which is line with the study reported by Ajileye [21]. Thus, this study revealed that the addition of global solar radiation in the model increases the accuracy as can be seen in the recommended three variable correlation model.
| Models | R2 | MBE | RMSE | MPE | NSE | IA | Total |
|---|---|---|---|---|---|---|---|
| Eqn.16c | 3 | 1 | 5 | 1 | 4 | 4 | 18 |
| Eqn.17d | 1 | 4 | 2 | 4 | 2 | 2 | 15 |
| Eqn.17f | 2 | 2 | 4 | 2 | 3 | 3 | 16 |
| Eqn.18d | 1 | 3 | 1 | 3 | 1 | 1 | 10 |
| Eqn.19 | 1 | 5 | 3 | 5 | 2 | 2 | 18 |
Fig. (12) shows the comparison between the measured and estimated radio refractivity based on the recommended models for Osogbo, Nigeria. The radio refractivity model, equation 16c underestimated (February - May) and overestimated (July - September and December) the measured and other estimated models. The estimated models follows similar trend with the measured radio refractivity; however, the model equation 18d was found to be more suitable for estimating tropospheric radio refractivity with the best fitting. The one variable correlation model that relates the radio refractivity with the relative humidity (equation 16c) can be used as it performs best based on the MBE and MPE.
CONCLUSION
In this study, the concern of developing empirical models for estimating tropospheric radio refractivity for Osogbo (Latitude 7.47°N, Longitude 4.29°E and altitude 302.0 m above sea level), Osun state located in the south western, Nigeria is addressed. The procedure recommended by the International Telecommunication Union (ITU) was implemented in the evaluation of tropospheric radio refractivity for the location during the period of twenty two years (July 1983 - June 2005) using monthly average daily atmospheric pressure, relative humidity and temperature data obtained from the National Aeronautics and Space Administration (NASA). The tropospheric radio refractivity obtained through this method was considered as the measured one as this is the general method, since radio refractivity data are not readily available in most meteorological stations. In fact in Nigeria no meteorological station measures radio refractivity.
This study utilizes meteorological parameters of atmospheric pressure, relative humidity, temperature and global solar radiation data to develop one, two, three and four variable correlation(s) models capable of estimating tropospheric radio refractivity for Osogbo. The developed models are compared
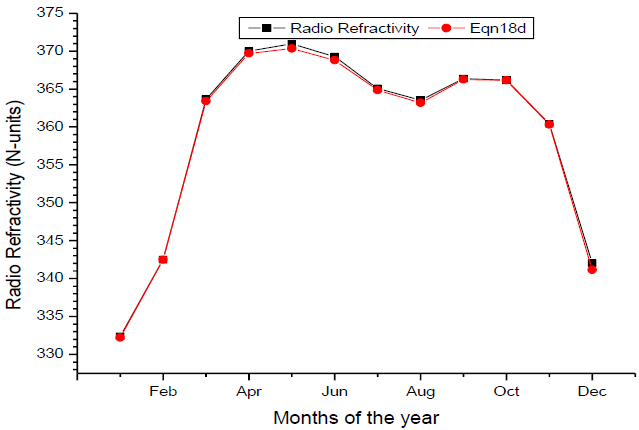 |
Fig. (10). Comparison between the measured and recommended estimated radio refractivity based on three variable correlations models for Osogbo, Nigeria. |
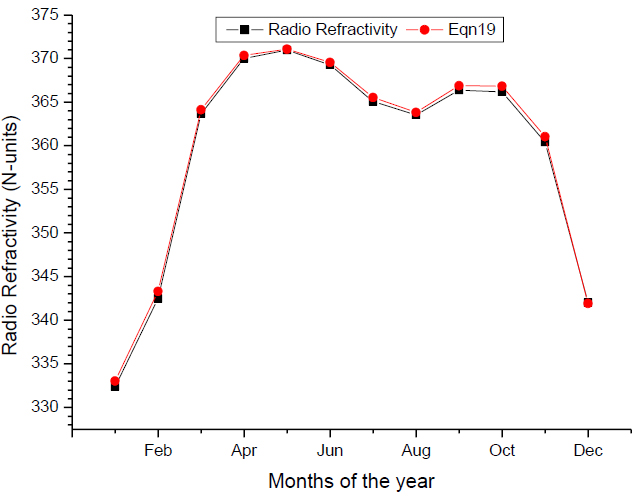 |
Fig. (11). Comparison between the measured and estimated radio refractivity based on four variable correlations models for Osogbo, Nigeria. |
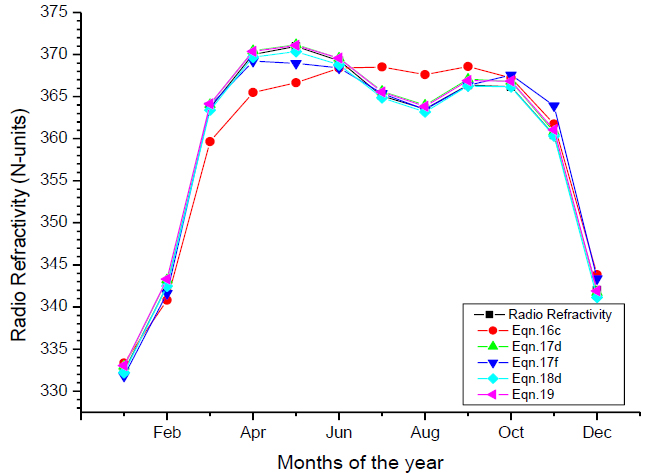 |
Fig. (12). Comparison between the measured and estimated radio refractivity based on the recommended models for Osogbo, Nigeria. |
on the basis of statistical indicators of coefficient of determination (R2), Mean Bias Error (MBE), Root Mean Square Error (RMSE), Mean Percentage Error (MPE), Nash - Sutcliffe Equation (NSE) and Index of Agreement (IA) to ascertain which model(s) reliably estimates tropospheric radio refractivity.
The results indicated that the empirical regression model (Equation 16c) which relates the radio refractivity with relative humidity was found more suitable for the one variable correlation with R2 = 94.6%, MBE = -0.0426 N-units, RMSE = 2.8806 N-units, MPE = 0.0058%, NSE = 99.9930% and IA = 99.9982%; the empirical regression models (Equation 17d and 17f) which relates the radio refractivity with absolute temperature and relative humidity with R2 = 100.0%, MBE = 0.4177 N-units, RMSE = 0.4988 N-units, MPE = -0.1162%, NSE = 99.9998% and IA = 99.9999% and the model which relates the radio refractivity with relative humidity and global solar radiation with R2 = 98.8%, MBE = 0.1343 N-units, RMSE = 1.3719 N-units, MPE = -0.0385%, NSE = 99.9984% and IA = 99.9996% were found more suitable for two variable correlations; the empirical regression model (Equation 18d) which relates the radio refractivity with absolute temperature, relative humidity and global solar radiation was found to be more suitable for the three variable correlations with R2 = 100.0%, MBE = -0.2913 N-units, RMSE = 0.3869 N-units, MPE = 0.0811%, NSE = 99.9999% and IA = 100.0000%; the four variable correlations empirical regression model (Equation 19) has the four parameters with R2 = 100.0%, MBE = 0.4422 N-units, RMSE = 0.5113 N-units, MPE = -0.1237%, NSE = 99.9998% and IA = 99.9999%. The three variable correlation empirical regression model (Equation 18d) was found more suitable when compared to the other recommended models. The evaluated recommended empirical regression models are found suitable for estimating daily and monthly tropospheric radio refractivity with high accuracy for Osogbo and its environ depending on the available meteorological parameters. This study appears to be the first attempt as there are no such studies on developing models for estimating tropospheric radio refractivity in Nigeria.
CONSENT FOR PUBLICATION
Not applicable.
AVAILABILITY OF DATA AND MATERIALS
Not applicable.
FUNDING
None.
CONFLICT OF INTEREST
The authors declare no conflict of interest, financial or otherwise.
ACKNOWLEDGEMENTS
The authors wish to appreciate the management and staff of the National Aeronautics and Space Administration (NASA) atmospheric science data centre under Surface meteorology and Solar Energy for making all the relevant data used in this present study available online. The contribution and suggestions of the anonymous reviewers are well appreciated.